


Rurals of Nevada: Children's Week and Rural Children (art. 15)
"Nevada is a childcare desert due to not enough infrastructure and childcare workers." - Governor’s Workforce Development Board Childcare Working Group, 15 February 2023


The week of 13 March 2023 was Children’s Week at the Nevada State Legislature, and I was able to help with the opening day’s activity and press conference. It is always a treat to see citizen participation and advocacy at work. And let’s face it—kids wandering around the Legislature with teddy bears are cute.
First, a disclaimer: I am currently working with the Nevada Child Care Fund project featured in the above photo. The comments below, however, represent only my own thoughts, not those of the Nevada Child Care Fund partners.
The question of child care costs has become a national discussion—or I should say more of a discussion. It is one of the perennial topics in a wide range of policy debates. But since the beginning of this year, a number of reports outlining child care crises have appeared. Authors range from the Women’s Bureau of the U.S. Department of Labor (Childcare Prices in Local Areas: Initial Findings from the National Database of Childcare Prices, January 2023) to the Nevada Governor’s Office of Workforce Innovation, also known as GOWINN (Childcare Policy Report: Governor’s Workforce Development Board Childcare Working Group, 15 February 20231) down to the annual reports of non-profits working closely on the issue such as the Children’s Cabinet (2022 Nevada Fact Sheet / Demographic Report).
These reports point to one major conclusion: Nevada is a child care desert.
While all of these reports share a common theme about child care crises, they are approaching the problem from different perspectives. The Women’s Bureau report, for instance, focuses heavily on the impact of exploding child care crises on maternal employment dynamics and family incomes. The economic impact of the lack of affordable child care is also a major focus of the GOWINN report. Given the continuing struggle of employers to find workers, such a focus is not surprising from organizations whose primary emphasis is the workforce. The economic issues have also been heavily discussed in the media, as in this article from the Nevada Independent.
Also in this economic realm, the Nevada Assembly Legislative Operations and Elections Committee heard a bill in the current legislative session arguing for allowing the use of campaign funds for dependent care for candidates (AB95—watch the hearing here). While it did not make it out of the committee, it was a stunning discussion. But given—ahem—other recent stories about the use of campaign funds, perhaps the less said the better.
But a strong counterargument exists that child care should primarily concern the child, not the employability of the parent. Extensive literature exists on the developmental benefits of early childhood education, focusing particularly on brain development in the ages before 6. The Centers for Disease Control (CDC) has a fairly comprehensive page on the issues. Moreover, the importance of the early development of “core” or “executive” skills such as resisting impulsive behaviors, maintaining focus for long-term goals, and adapting to changing situations (see this discussion on these skills from Harvard University). Governor Lombardo echoed these beliefs in part in his 2023 State of the State address, stating the need “to ensure more students are ready for school, when they get to school.”
Of course, these two positions—economic and child developmental—are not mutually exclusive and moreover, each can express vital societal goals. But this brief survey of the recent reports with its diversity of motives indicates that for a number of people and a number of institutions, child care is facing serious crises in Nevada.
So, where to start in understanding the child care issues? The obvious answer is with the children. This question provides a wonderful opportunity to dig into another set of demographic data. Yay!
Children in the Three Rurals
One of the themes of this article series has been the “aging rurals” myth and how it applies across the Three Rurals. In Article 5, I looked a bit at the Under 18 population based on the results released to date from the 2020 Census. Just to review, the Western Rural (Churchill, Douglas, Lyon, and Storey) and Central Rural (Esmeralda, Lincoln, Mineral, Nye, and White Pine) counties have demographics that warrant the soubriquet “aging rurals.” But the I-80 Corridor—Elko, Eureka, Humboldt, Lander, and Pershing—are among the youngest counties in the state by multiple criteria.
Of course, not all those Under 18 are the target audience for child care. The most critical group is those from 0-5 years of age. Not only is this group in need of full-time care (even with increasing participation in pre-K programs) but also requires much higher levels of attention (read “staffing”) and specialized facility design—especially for infants. This age group also is of the most concern for brain and skills development.
But a second group, those of school age up to about 9 years of age, are also an important component of child care concerns. While most members of this age group are in school, after-school and out-of-school holiday care is still a major concern. Therefore, it is useful to have some data on both groups, both individually and collectively.
The 2020 Census data released to date will not provide useful age information for these levels yet. The next major 2020 Census data products, the Demographic Profile and Demographic and Housing and Characteristics (DHC) File, have just come out and will cover the age breakdowns, but it will take me some time to work through them. Correlating age with detailed race and ethnic data will not be possible until August 2023, when the Detailed Demographic and Housing Characteristics Files (Detailed DHC and Detailed DHC-A) products are released. I will be covering these as well.
Until then, the best national-level data remains the American Community Survey (ACS) data. The latest 5-Year Estimates, covering 2017-2021, were released in April 2022. As I’ve discussed previously (see the first Aging Rurals article here), the ACS presents some problems for low-population geographies common in rural Nevada. In short, the small sample size of many rural areas leads to some odd situations, as well as “swinginess” from survey to survey. But, needs must, so . . .
For the two age groups of interest, the Under 5s and those 5-to-9, the numbers are provided in Table DP05. While exact numbers might be needed to assert how many child care “slots” are needed, the purpose here is to look at the overall situation. Given we are already dealing with small survey size issues, percentages are better to get some rough demographic information. So, the table below gives the percentages of children Under 5, 5-9, and combined (0-9) across the Three Rurals compared to the urban counties, Nevada, and the United States.
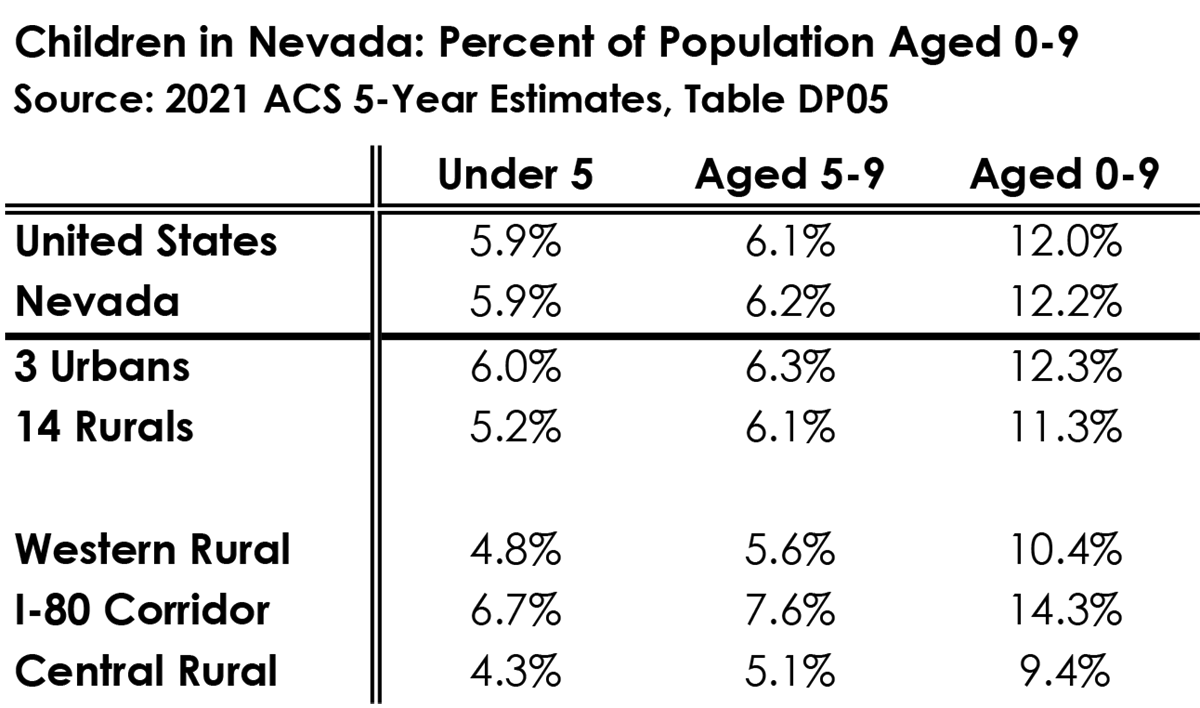
Again, Nevada is right at the national average in these categories. It has a few more children between 5 and 9, but not many. And the urban areas of Clark and Washoe Counties and Carson City have slightly more children under 9—but again not too far off national averages.
The rurals collectively have slightly fewer children—mostly those Under 5. The rural percentages of those 5-9 are about at national average. In short, no lack of children in the rurals generally. Certainly, there is not a massive absence of children widely believed to dominate rural demographics.
But not all rurals are equal. The I-80 Corridor remains the youngest area of Nevada.
But not all rurals are created equal. The I-80 Corridor counties have significantly higher percentages of children and largely are responsible for the rurals collectively being similar to the three urban counties in child demographics. Indeed, the child percentages in the region are the highest in the state (the actual numbers, however, are far smaller than the urban counties). It further undermines the long-standing argument that the youthfulness of this area is due primarily to miners in their 20s and early 30s. There are a lot of families and a lot of children.
But the wide variety of child percentages across the rurals is one of the factors compounding policies for child care. While the Central Rurals might come close to what many people imagine childless rural areas look like, the I-80 Corridor is atypical of even the urban counties. And given the spatial spread of the population, child care becomes even more complex.
Rural Children and Parents
But there is also another factor—a “myth” if you will—that child care is a lesser concern in rural areas due to more extensive family networks which can help. Whether it be married couples where only one parent (usually the father) works or grandparents or other relatives who can step up to assist, rural populations tend to handle child care in-house (often literally). Therefore, the institution-based child care centers common in urban areas are not needed—or, indeed, necessarily wanted.
How accurate is this belief? Unsurprisingly, data to support this one way or the other is very difficult to come by. Tracking extended family networks is an involved process—let alone what services members of those networks might provide to other members. Just ask any anthropologist or any number of historians.
What we can do more readily is look at some census data about households, children, and parents. Of course, using households as the basis presents problems on its own—namely, not being able to “see” individual children. A household with one 17-year-old is no different statistically from a household with 5 children aged 1 to 12. Unfortunately, the primary ACS data table for this (Table 11005: Households by Presence of People Under 18 by Household Type), covers more than the child care target ages. Still, I think it can provide some insight into the question of differences between rural and urban family structures.
According to the 2021 ACS 5-Year Estimates, Table 11005, over 97% of children Under 18 live in homes with their parents, whether the parents are single or married (although not necessarily to the other parent—that is a separate discussion). That is the good news. Despite the tragedy of foster or emergency-placement children in rural areas, they are a relatively small portion of the child population.
The more depressing news is that Nevada is close to the national average of just over 30% of households having children Under 18. This is one of the markers of “aging of America.” And while the 3 urban counties are at the national average, as the chart below shows, the rurals collectively are only slightly behind at 27.3% of households with minors. The fact that the numbers are close at all also indicates that the rural child populations are more evenly spread rather than concentrated in a relatively smaller number of large families (another “myth”).

Yet when the Three Rurals are examined, the situation reads differently. Just over a quarter of households in the Western Rural area (25.5%) have children, and barely 21.4% of households in the Central Rural. Both are well below the state and urban percentages.
Unlike the rest of Nevada, if you live in a house with neighbors on either side of you in the I-80 Corridor, one of the three of you has children under 18.
And then there’s the I-80 Corridor. More than a third of households in the region have children Under 18. Following up on my “Walk in the Park” metric, there is another way to view this statistic. In the I-80 Corridor counties, if you live a house with neighbors on either side, one of the three of the houses have children present. That is not a given elsewhere in Nevada.
One final oddity with this household dataset: the question of married versus single parents. Overall, Nevada has more single-parent households (38.6% of all households with children Under 18) compared to the nation as a whole (33.8%). Of course, that also means fewer married-parent households by almost the same amount.
But when we look at the rurals, there are significantly more married-couple households—particularly in the Western Rural and I-80 Corridor counties. Both exceed the U.S. percentage of 65.3%, with the I-80 Corridor just under 70%. These numbers may indicate there is something to the idea of greater family cohesion in these areas.
The Central Rural counties, however, show a dramatically different pattern, much closer to the 3 urban counties in a higher percentage of single-parent households. The difference is striking. While it might be tempting to see this as a potential artifact of the small samples in these counties rather than actual practice, I suspect there is something else going on. Given how close the numbers are to those of the urban counties, I think what is being captured is the outsized (and increasingly urbanized) population in Pahrump in the sample. If Pahrump were eliminated, I suspect the rest of the Central Rural to look like the other rural counties.
Working Parents with Children
With those numbers in mind, we can turn back to the more economic side of the equation. It would be wonderful if parents could stay home with their children all day. Unfortunately, that is not a viable option. The child care crises exist in large part because of the need of single parents and many two-parent families to work.
It is precisely because of this fact that we can actually grapple with key data directly. The ACS includes a data set (Table B23008) looking directly at the number of Children Under 6 living in homes where all parents work. Of course, the distinction between “Under 6” and the “0-5” category used above. Although both address the same group—children needing full-time care as opposed to after-school/holiday care—the slightly different ages make comparisons between data sets much more difficult.
The table below shows the percentages of children with working parents in the various regions I have been discussing. The fact is that almost two-thirds (66.9%) of children Under 6 in the United States live in homes where all parents work—hence the national child care crises. Nevada is a bit better at 64.6%, but not much.

But in particulars Nevada actually diverges somewhat from national patterns. While fewer children are living in homes where both parents work, a slightly higher number live in single-parent homes where the parent is working. This dynamic is most pronounced in the 3 urban counties, where roughly a third of children under 6 live in homes where both parents work, a third in homes with a single parent who works, and a third in a home where at least one parent does not work.
But when the rurals are examined, the story becomes much more complicated. First, significantly fewer children Under 6 are in single-parent households. The numbers are almost 5% lower than the U.S. percentage and almost 9% lower than Nevada as a whole. Given that these percentages are higher than the differences in single-parent households discussed above, I think what is occurring in the rurals is a number of single-parent households with older children, mostly school age or teenagers, than in the urban areas.
More intriguing is the differences between the Three Rurals. For once, the I-80 Corridor counties present an uncomplicated dynamic. The number of children Under 6 living in households where both parents work is almost 9% lower than the Nevada average (55.7%). The much lower percentage of children in single-parent working households (21.1%, compared to 30.5% for the state), even if the number of children in working married-family households is slightly higher, likely accounts for the large difference.
The Central Rural counties have the lowest percentage of young children living in households with working parents—only 41.6%. Moreover, this is evenly divided between married households with both parents working and single-parent households. Again, it appears that many of the working single-parent households in the region have older children.
It is the Western Rural region that stands out in this data. Almost 7 in 10 (69.3%) of children Under 6 live in households where all parents work. Moreover, a significant portion of children in married-couple households have both parents who work (46.3%), almost 6% higher than the nation as a whole. I suspect what might be happening here is the impact of becoming more suburban. Reno is attracting a number of hard-working families, but costs and low availability means living in neighboring counties is a must.
Preliminary Conclusions
It is clear that there is no lack of children in the Three Rurals, meaning that child care is not solely an urban issue. Certainly the numbers are overall lower in rural compared to the urban counties. But these children are spread over a much larger area, meaning transportation and density of infrastructure are major problems—if the infrastructure exists at all.
The differences between the rural regions, however, also present significant additional difficulties. Programs tailored for single parents, for instance, might miss the larger numbers of married-couple families where both parents work. Likewise, assumptions about the availability of family-care networks might lead policymakers and non-profits to underestimate the pressing need in the rurals.
And all of this is before we tackle the financial situation of families—which in the rurals can significantly impact the perceived need and possible use of aid. I want to explore that in a future article.
Thanks again for reading. As always, please feel free to share and leave comments.
At the time of publication, the GOWINN site is undergoing a rebuild. I am assuming this link will remain after the rebuild but will fix if they change it.