


Nevada Growth and the RUCC, 2010-2023 (Rurals of Nevada art. 22)
Some inside baseball examining how the "ruralities" based on the USDA's Rural-Urban Continuum Codes (RUCC) match up to changes in Nevada's growth. And a Squid Graph.

, and Net Migration. Used for illustration in this article.")
Back in December 2024, I began this multi-article exploration of Nevada’s growth patterns largely because of the graph above from the 2024 edition of Rural America at a Glance. Figure 2 shows the percentage change in population in the various categories (“ruralities”) from both natural change (births minus deaths) and net migration. This graph is the basis of the argument in the report that rural America is growing again. I want to look at how closely these patterns track across the Rurals of Nevada—which means grouping Nevada counties similarly to how they are grouped in the graph.
The “rurality” categorization is based on the USDA’s Rural-Urban Continuum Codes (RUCC) as I discussed in the first article of the series (read it here), but not exactly the same. While each county has a separate code, the chart above and the associated discussions about growth rates are based on the rurality groupings of Metro (RUCC 1-3), Small City (RUCC 4-5), Small Town (RUCC 6-7), Rural Adjacent (RUCC 8), and Remote Rural (RUCC 9). I am not sure exactly how this grouping was devised; it did not appear in earlier reports that I have found. That means I need to grapple with what this grouping might mean—which is the point of this article.
The rurality concept introduces an intriguing wrinkle into discussions about growth rates beyond just matching data for comparison to Rural America at a Glance. One of the issues with the RUCC system is that while it is based on the decennial Census data, the classifications are updated about three years later. So the original RUCC map was devised in 1973, based on the 1970 Census, then in 1983, 1993, 2003, 2013, and 2023. This leaves an odd gap in any efforts to look at longer growth rates as both county classifications shift and the estimate baseline is adjusted at each decennial. It also means the RUCC system is not really intended as a longitudinal system, able to track changes over long periods.
A larger issue, in my opinion, is the development model embedded in the RUCC. The “Continuum” part of the acronym is based on an idea of metropolitan spread, with rural areas gradually becoming more metropolitan. This conception lays one foundation of the “Dying Rurals” myth in holding that rural communities have no self-sustaining future. They are doomed to either largely disappear as the nation becomes more urban or be relegated to irrelevance. If the rural growth trend is reversing—either by natural growth or migration—that is worthy of a look.
This article will be a bit more inside baseball than policy. The growth data itself makes sense; it is categories into which that data is gathered that I find problematic.
This article will be a bit more inside baseball than policy. I think the growth data makes sense; it is categories into which that data is gathered that I am struggling with. I do not think the “Rurality” grouping is intended as a new, permanent classification, but by virtue of being used in a series such as Rural America at a Glance and the potential impact of rural growth, it needs to be examined.
RUCC and Rurality
While the rurality categorization appears not to have been presented until the 2024 edition of Rural America at a Glance, it is based on the RUCC codes. Therefore, we can devise earlier groupings easily. Below is a short summary of the “rurality” classifications from the above table for Nevada counties since 2003, how Nevada's counties would have been categorized over the roughly last quarter century. The data is taken from the USDA ERS’ “Rural-Urban Continuum Codes” website. The RUCC classification for each category is given in parentheses.

First, it is not an error that Pershing County is listed twice in the 2013 listings. The 2013 ERS data has Pershing as RUCC 9. The problem is that not only is this a change from the 2003 and the 2023 categories, it makes no sense. The difference between RUCC 8 and RUCC 9 is based on location (adjacent to a Metro county or not), and certainly the county did not move further away from Washoe in 2013 (or move closer in 2023). It also means that Lincoln was the only “Rural Adjacent” county after 2013, despite Caliente being much further from Las Vegas than Lovelock is from Reno.
I actually think this is an unintended error in the ERS’ data. With almost 2,000 rural counties in the U.S., some problems will happen. For the following discussion, I am including Pershing in the “Rural Adjacent” (RUCC 8) category.
Back to the chart. In the three upper categories (Metro and Small City), there is a gradual shift of some counties up. Nye and Lyon go from Small Town to Small City, and by 2023 Lyon moves from Small City to Metro. The same thing happened to Carson City and Storey, which moved into the Metro category by 2003. This movement is the embedded development model in a nutshell.
The chart follows the developmental model the RUCC is based on: some counties in the upper tiers climb towards Metro designation over time, while others in the lower tiers stagnate.
But for most counties classed from Small Town or below (RUCC 6-9), they hardly change at all until the system was re-aligned in 2023 (more on that in a minute). Again, this static categorization fits the developmental model well. For the most rural counties, outside of commuting areas or too small to attract people, nothing much in the way of development occurs.
The 2023 re-arrangement RUCC county classifications was prompted by the Office of Management and Budget (OMB) upping the minimum for urban density to 5,000 persons (up from 2,500). After more than half a century, this change was certainly justified. The result was forcing three smaller counties (Lander, Mineral, and White Pine) to more rural RUCC classifications—and thereby dropping them into lower “rurality” categories.
I think the 2023 RUCC-based “rurality” arrangement make a bit more sense. The question is does it reflect actual and future growth patterns. That remains to be seen.
Nevada Growth Rates Based on RUCC 2013
With the categories settled, we can dig into the data. My first effort was to follow the classification schema of 2013 as a baseline. I zeroed the growth rate in 2013 and then calculated the cumulative growth rate since that point, again as percentages. So the years 2010-2012 used the 2003 RUCC classifications, while the 2013 RUCC codes were used from 2013 forward. I kept them through 2023, although technically it should have been zeroed out with the 2023 RUCC classifications back to zero.
This approach, I thought, would capture the effect of the classification over a decade—which is how I imagine the RUCC is used from year to year in the Rural America at a Glance series. Technically, it means that the “results” of the decennial Census are effectively only incorporated 3 years into the model. It also means that any interpretation is limited to roughly a decade of data.
So what might a decade’s worth of data based on the 2013 RUCC classifications look like? I used the same data Census Data Annual Estimates of the Resident Population for Counties: April 1, 2010 to July 1, 2019 (CO-EST2019-ANNRES-32) and April 1, 2020 to July 1, 2023 (CO-EST2023-POP-32). The result was rather striking, as seen in Figure 2, below. I have affectionately dubbed this the “Squid Graph.”
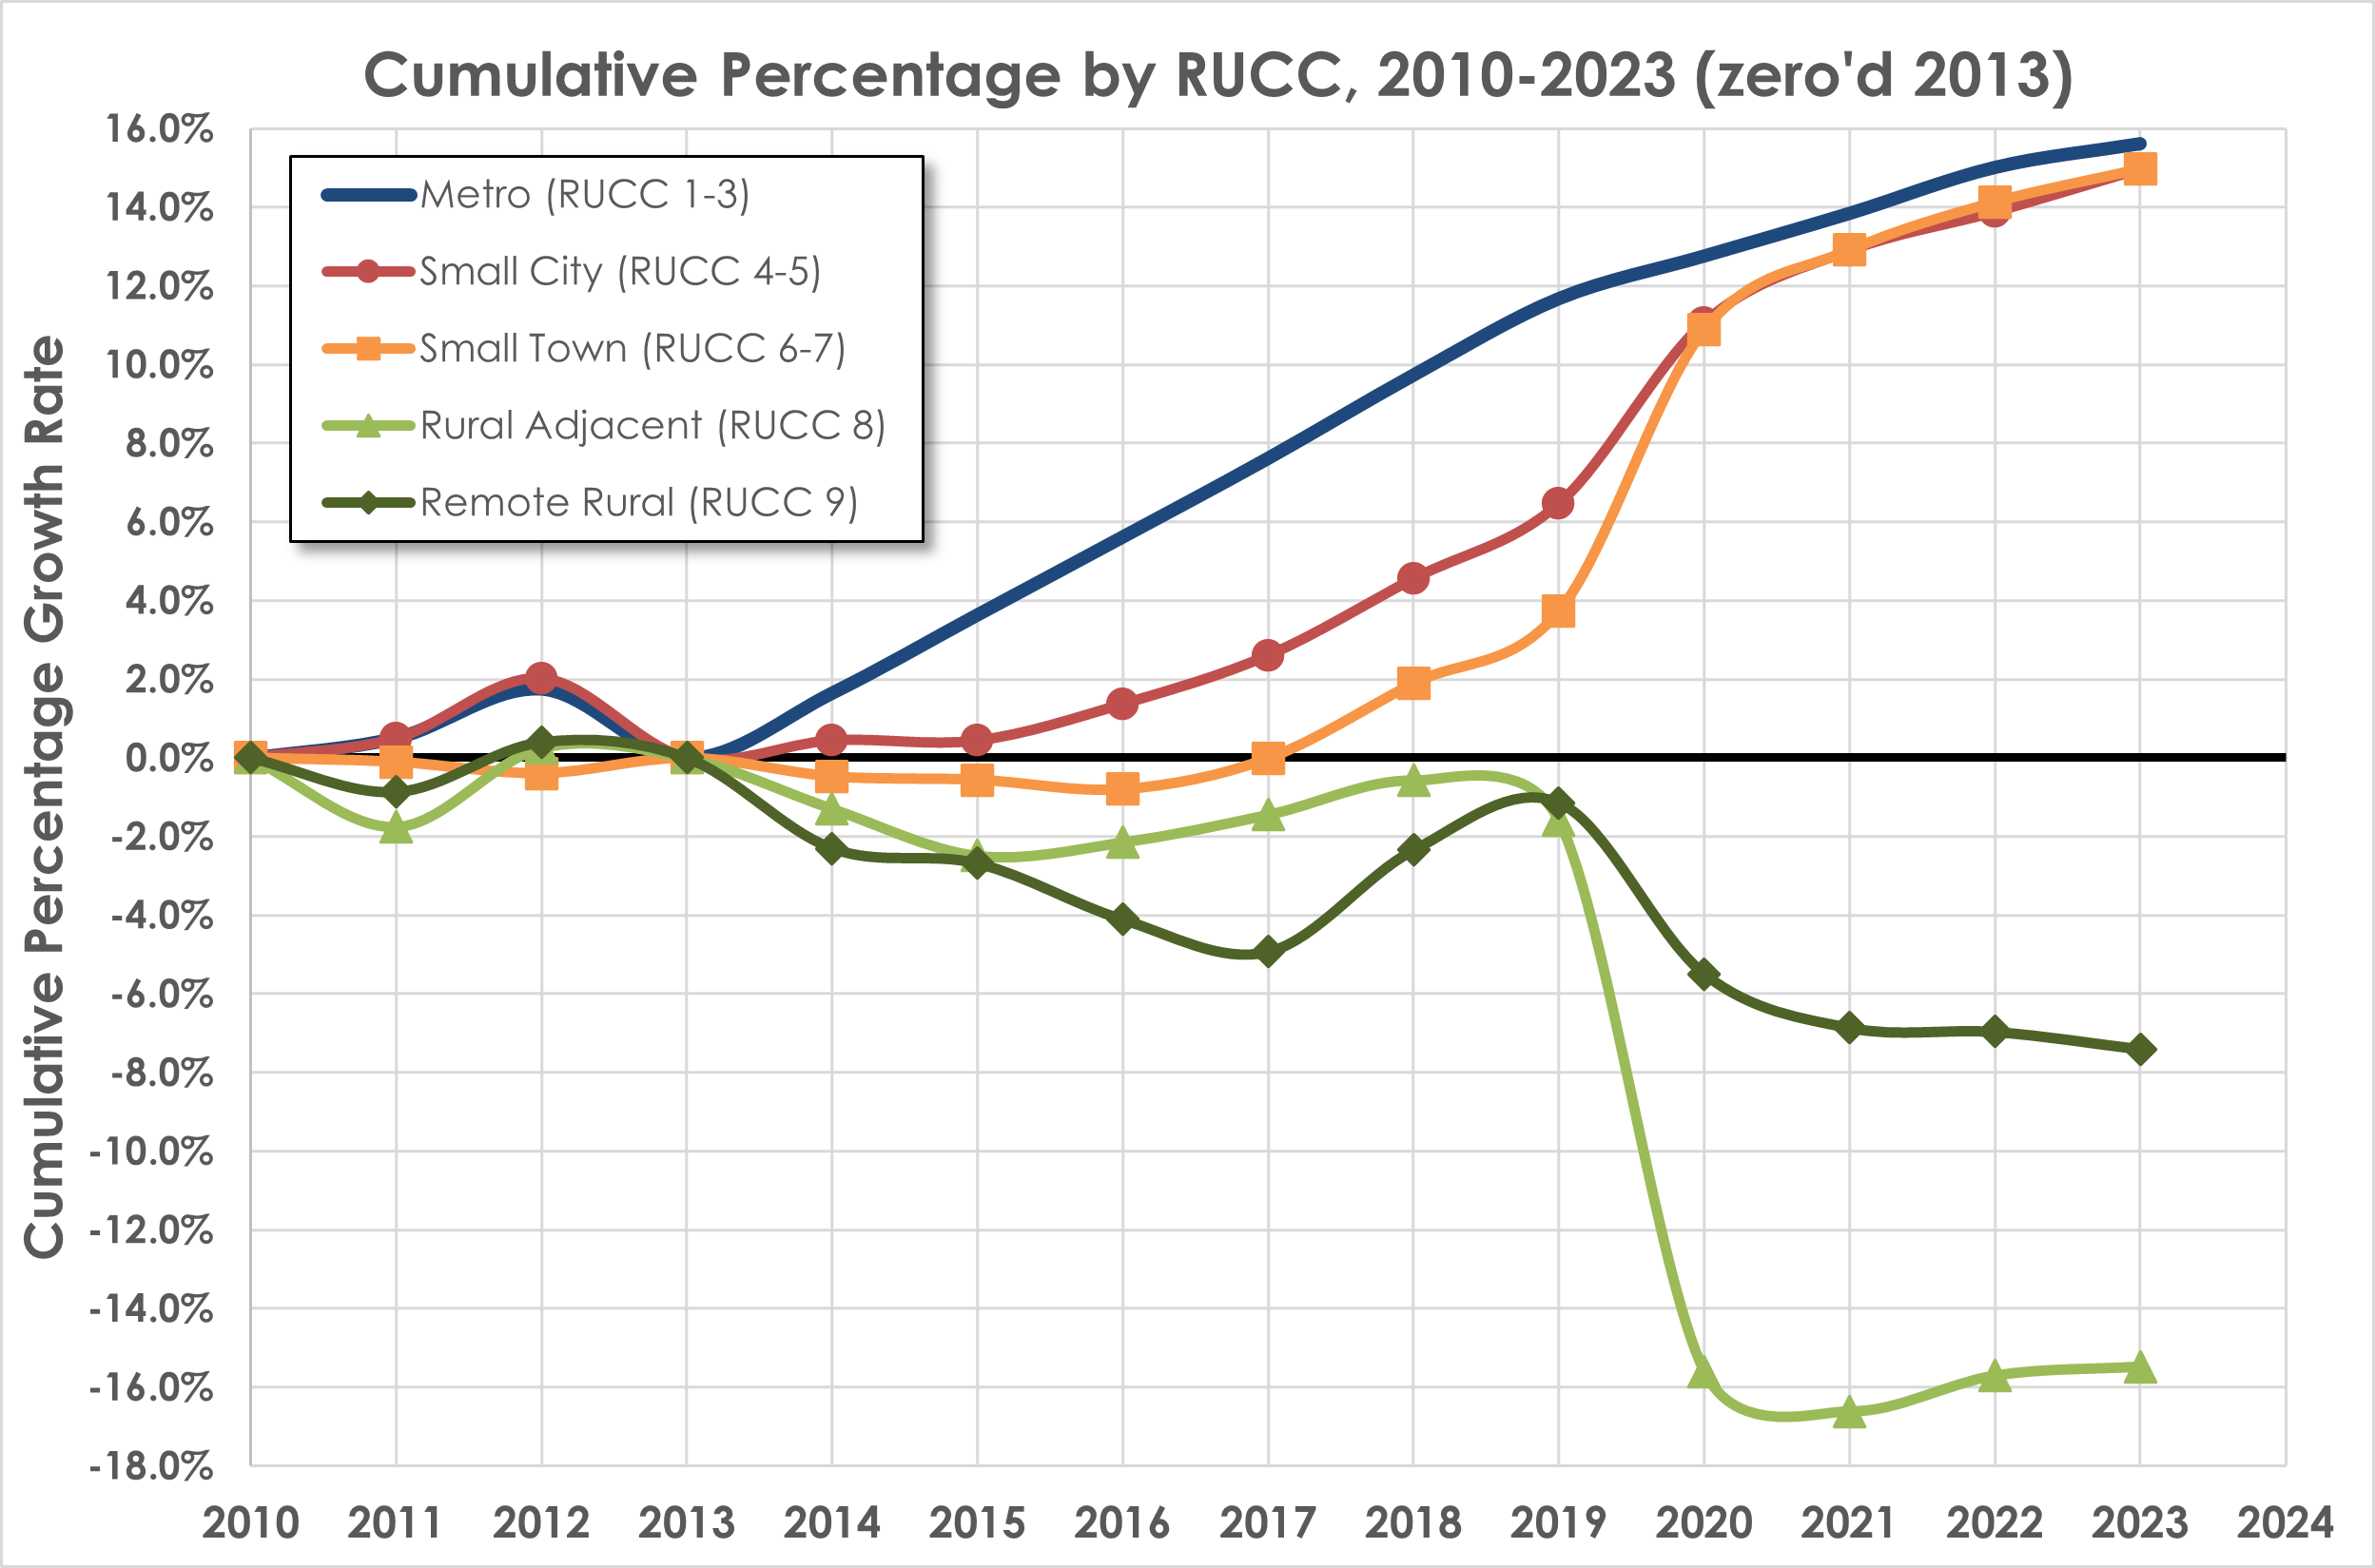
Obviously, this particular model is difficult to interpret. Note in particular the stark difference after the 2020 Decennial Census. The Metro counties (RUCC 1-3—Clark, Washoe, Storey, and Carson City as of 2013) have a pronounced growth trend, which slowed somewhat after 2020. Given the size of metro areas, the sampling used for intra-decennial population estimates is more accurate and more consistent.
But the non-metro (or rural) counties—whoa, boy. They require some explaining. Up until 2019, the growth rates for the “rurality” categories do not look that different from the graphs examined in the last article on county and regional growth rates. The Small City (RUCC 4-5) and Small Town (RUCC 6-7) groups stayed static until 2015 and then started growing. This pattern appears to be a delayed following of the Metro growth rate, similar to what I discussed in the last article.
The Rural Adjacent (RUCC 8) also roughly follows this pattern, but only after suffering population decline for a few years before growth began. For the Remote Rurals (RUCC 9), the decline was more pronounced and lasted longer, until 2017. But once this group began growing, it rapidly made up the loss by 2019 and equaled the Rural Adjacent growth rate.
Note that the growth rates follow the ruralities classification in descending order—the lower the RUCC numbers of the categories, the lower the growth rates. Is the model that good, or is the model structuring the data?
But also note that the growth rates follow the ruralities classification in descending order—the lower the RUCC numbers of the categories, the lower the growth rates (with one exception I will discuss below). This is one of the odd items to me in that data follows a model so closely. So is it that the model is that good, or is the model structuring the data?
The 2020 Census changed all these dynamics drastically by causing these groupings to diverge. The divergence was undoubtedly caused by failures in the previous models The Small City and Small Town groups jump, indicating that they had been underestimated by the 2010 baseline model. Once adjusted, the Small City and Small Town groupings (RUCC 4-7) effectively merge and closely parallel the Metro counties—as in almost exactly.
The dynamics for the other two groups (Rural Adjacent and Remote Rural) have just the opposite effect. They dropped dramatically with the 2020 Census, indicating a severe overcount before 2020. Both have significantly lower growth rates than the other ruralities.
More surprising, however, is that the Rural Adjacent drops faster than Remote Rurals. Note that the sharp downturn started in 2019, just before the 2020 Census adjustment. Since the 2020 adjustment, the Rural Adjacent has seen slight growth and the Remote Rurals a slight decrease. But it is clear something is clearly out of whack (is that a technical term?) with the Rural Adjacent classification.
As interesting as the Squid Graph is, it is hard to see it as adequately reflecting an accurate reflection for the growth of Nevada’s counties. The ugly split caused by the 2020 Census adjustment indicates a real problem with the model overall.
Nevada Growth Rates Based on Decennial Census
But what if the starting point were adjusted? The core problem above was starting three years after the baseline was established. What if we moved the baseline back to the decennial Census and started from there? It is not how end-users (i.e., the readers of Rural America at a Glance) would see the information presented, but it makes more sense from a model perspective.
My second attempt was to retroactively match the 2013 RUCC categories to the decennial Census on which the data was based. So cumulative growth rates starting in 2010 were based on the RUCC classifications released in 2013. I also added the 2023 RUCC categories, starting with the 2020 decennial. The same datasets used above were used here as well.
I admit there was a bit of a hitch accounting for the adjustment for the 2020 decennial—I skipped the more complicated calculations necessary to track growth precisely over 2019-2020 as the classifications changed. However, since I am interested in the long-term growth pattern, this shortcut will not impact what I am trying to do. The growth rates on either side of 2019-2020 will be consistent.
The result is graphed out in Figure 3, below. This graph still has the “tentacles,” but interpretatively the graph makes far more sense.

Although the ruralities show far more divergence, they also show recognizable patterns. In fact, it looks rather similar to the individual county growth patterns from the last article. The Metro counties stagnate a bit initially but then grow dramatically after 2011. For the other categories, there is a longer period of decline, until roughly 2017 or so before growth started. But growth in the Small Town, Rural Adjacent, and Remote Rural counties stalled and began to decline after 2020.
The Remote Rurals (RUCC 9)—Esmeralda and Eureka counties—show more variability. But remember that these two counties between them only have about 2600 people, so any change will tend to cause bigger swings. I have real suspicions over what this growth pattern might actually mean.
The only rurality to show consistent growth is the “Small City” counties—Douglas, Elko, Lyon, and Nye Counties.
Note one key factor: the only rurality to show consistent positive growth since 2010 was the Small City category (RUCC 4-5). Over most of this period, this rurality comprised Douglas, Elko, Nye, and Lyon counties. Lyon, remember, became classified as Metro in 2020. Again, this matches the conclusion reached previously: only a small number of counties in rural Nevada are consistently growing.
One final observation. Unlike the previous model, the Rural Adjacent rurality (RUCC 8) is consistently losing population faster than other areas, especially after 2018. For most of the period, this group comprised Lincoln and Pershing counties, with Mineral added after 2020. I highly suspect there is something going on with the Rural Adjacent counties—they seem to be losing population in ways the groups on either side, even the Remote Rurals, do not appear to be. Something else to keep an eye on going forward.
Conclusion: Models and Muddles
If you have read this far, thank you for your patience with my fascination with models.
As I said at the beginning of this article, the RUCC was never really intended to serve as a long-term data model. The same applies to the “rurality” categories. They are rather a short-hand way of categorizing change without having to go county by county. While introducing the new RUCC categories three-years into a Census cycle is necessitated by the amount of calculation needed to be done, it does create some real problems with using the data for anything but a yearly snapshot. But like many bureaucratic expedients, these classifications have a tendency to become perceived as defining—reified, in the humanities sense.
That process is more significant given the claim that rural counties are growing again. Although not noticed on a national scale by USDA ERS until 2023, it appears to me that some of the Nevada counties were growing well before then—but not all. Like it or not, trying to work through these models is necessary not only to understand what USDA is seeing, but how other policymakers might look at Nevada through the lens of USDA’s Rural America at a Glance and other federal programs.
Going forward through the next few articles, I will deal more with the actual data for Nevada. But these various models will always be lurking in the background.