
Data, Narratives, and Whatever is Up with Nevada's Voter Rolls, Part 1 (art. 26)
The flurry of articles about the impact of automatic voter registration in the last month indicates that we have some serious questions to answer.


The release of the December 2025 voter registration data by the Secretary of State’s office generated more than the usual flurry of year-end news stories. This year, the emphasis has been on a rapid increase in Non-Partisan voter share and concurrent declines in Democrat and Republican party registration share. The question is whether this represents a change in political culture in Nevada or is a side-effect of recent voter registration policy changes.
The policy in question is Automatic Voter Registration (AVR), where after January 2020 a voter is automatically registered when they update driver’s licenses or identification cards. This practice is set up under Nevada law as opt-out; that is, you will be registered unless you tell them not to register you. And as originally designed, if a party was not selected at the time of registration, the voter was classified as Non-Partisan.
But in January 2025, the DMV, overwhelmed by the workload, asked to change policies (AB433 and AB422 amendments) to not allow people to choose their political party when registering. Voters wishing to associate themselves with a party had to go through their county clerks, which required looking for and responding to a separate mailed letter. If you do not respond to this letter, voters already registered with a party continue with that party; everyone else becomes Non-Partisan.
In other words, the initial “simple” AVR process was complicated for bureaucratic efficiency, resulting in something not much different than the old way voter registration was done: you register with the county clerk to select a political party.
Two very good articles on this topic have attracted my attention. The Nevada Independent’s Eric Neugeboren started the year with “Nonpartisans are surging in Nevada. Is a recent policy change the reason?” (January 2nd, 2026). If you are not reading Neugeboren’s articles, you really should. He is doing some first-rate data digging, even though I disagree with a number of his conclusions. His article focuses on the numbers from 2025, during which Democrat and Republic numbers plummeted and Non-Partisan registrations skyrocketed.
The second was released just last week (from when I wrote this) in the Reno Gazette-Journal, “Party Changes: Nevada Democratic, Republican parties lost tens of thousands of voters” (January 15th, 2026—paywalled). Mark Robison takes a slightly longer-term view than Neugeboren, looking at the changes since the introduction of AVR in January 2020. Robison also pulls in more of the national analysis as well as the perspective of Vote Nevada, an organization seeking electoral reforms such as open primaries in Nevada.
For a deep dive on the actual numbers, Doug Goodman has done a very good breakdown on the 2025 data over at Nevadans for Election Reform.
Despite the difference in approaches, all of these sources reach similar conclusions: the growth of Non-Partisans in Nevada and the decline of major parties reflect a conscious political choice of voters—even if somewhat inflated by how registration is done. The changing numbers actually reflect an electorate shifting away from the two major parties.
I find that hard to read into the data given the AVR policy effectively places Non-Partisan registration as the normative state unless a voter says otherwise.
Let me add I do believe that some voters are rejecting the two-party model. If nothing else, the national data shows this. What I am questioning is the extent of this shift here in Nevada—and the narrative that this shift represents some existential crisis in elections that requires massive changes to electoral policy such as open primaries to “correct.”
Presentation of Data . . . or a Narrative?
Remember the adage “anecdotes are not data.” This hoary saying is often used to assert the primacy of quantitative information over personal experience and, too often, the value of qualitative values at all.
But we are living in a society that increasingly values “stories” or “narratives” over data and is (in my opinion) increasingly blurring the difference. Oh, we claim it is all based on data—but data is subject to interpretation. In our efforts to “tell a good story,” that interpretation too often treats data more as an embellishment to the story than the basis.
I think that is one of the problems going on with the debates about the growth of Non-Partisan voters. The limited focus on party registration data is creating an embellishment rather than clear data.
Let’s go back to the graph at the top of the article. From 2016 to 2019, there is little relative movement between the parties. A slight decline in Democrats in 2016-2017 and a slight increase in Non-Partisans until 2019 are notable but relatively minor.
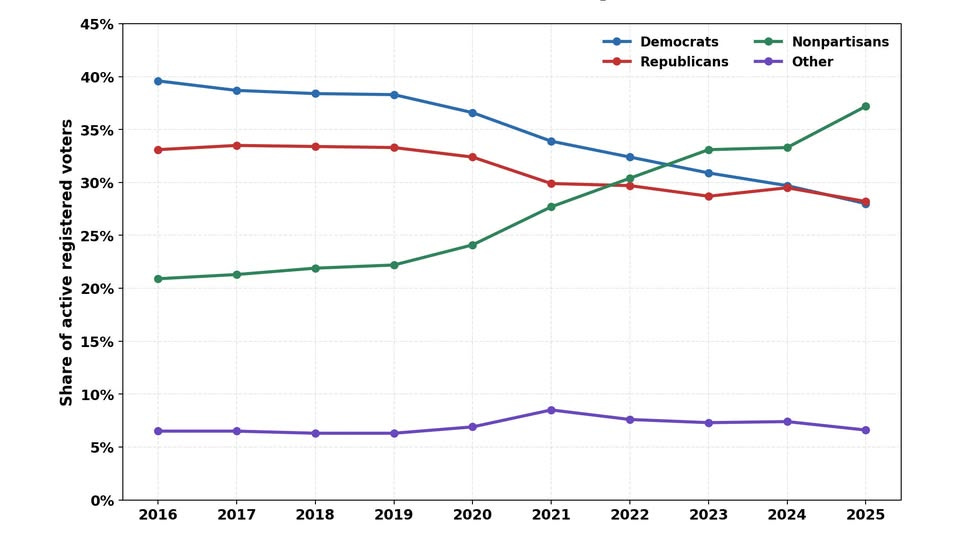
But between 2019 and 2020, the tumultuous period of COVID, Non-Partisans turn up and the two major parties start to decline. These trends accelerate significantly between 2020 and 2021, when AVR is introduced and the lead-up to the 2020 election. Note that then Non-Partisans grow at a steady rate—but party declines flatten out even as they continue. This, I would argue, is AVR capturing new voters who are not bothering to choose a party.
From 2024 to 2025, these trends accelerate—and even independent party registrations drop. It is hard to fathom that numerous people are making a voluntary choice to abandon all political parties in an off-election year, which 2025 was. Are they paying that much attention, and what would be the point of doing so in 2025 as opposed to 2026 or, you know, just not bother to vote?
One other odd fact is that the Secretary of State’s presentation of the registration data changed abruptly in December 2022. Previously, the monthly reports listed the political parties in alphabetical order, starting with Democrats and running through to Republicans, meaning Non-Partisans were in the middle. Starting in December 2022, the information grouped Democrats and Republicans first, then two largest third parties (the Independent American Party and the Libertarian Parties), then Non-Partisans and then everyone else (“Others”).
Why the change was made was not clear. But one aspect of the new presentation, to me at least, was that it subtly embraced the “anti-two-party” narrative. By grouping the two major parties first, the hint was that their registration was the “norm”—and that others following were the variations (or rejections) of that norm. As the numbers at the end of columns increase (reading left to right), the impression is voters are moving away (literally on the page) from Democrats and Republicans.
Nothing above invalidates the narrative that voters are choosing to be Non-Partisans. But it is very hard to ignore that major changes in party registration relationships happen after policy changes that increasingly make it harder to choose a specific party. Quite a coincidence. And the latest change is difficult to reconcile with some aggregation of voter choices, especially when the change is occurring in a non-election year when most people are not paying attention.
To get at what is going on, I think we need to look at data other than merely the state-level party registration data to test the narrative one way or the other.
Voter Turnout - The Missing Variable
Let’s start with the basic reason for the introduction of AVR, which had nothing to do with the relative strengths of the political parties. Rather, the idea was that by making registration easier, the number of people voting would increase.
The argument is that people are not voting because they are not registered—either by choice or because they found it difficult to do so. The “too difficult” argument holds that obstructions to registration are keeping people from voting. As Yuval Levin notes in his recent The American Covenant this argument is the dominant view of the political left. People would vote in high numbers if it were not for policies such as having to register in person, show identification, vote in person, and so forth.
So AVR and similar laws such as 2021’s AB432 (allowing social services to register voters), passed by Democrat-dominated legislatures, had a defined goal: increase voter participation by making registration easier, removing one of the obstacles. Now that we are five years into this experiment, we should see not just changes in voter registration practices but also increased turnout in elections as people find it easier to vote because they are registered. Seems simple enough, right?
Here’s what the data shows. I used the December data from 2015 through 2025 as a baseline. Since there was quite a bit of variation year-to-year, I added a simple linear trendline. For the five elections during the period, three presidential and two midterms, I used the total number of votes cast in each election (along with the registered voter totals for the election months). I did separate the Presidential and Midterm elections into two lines to avoid the “rollercoaster” that results when you try to graph turnout every two years.
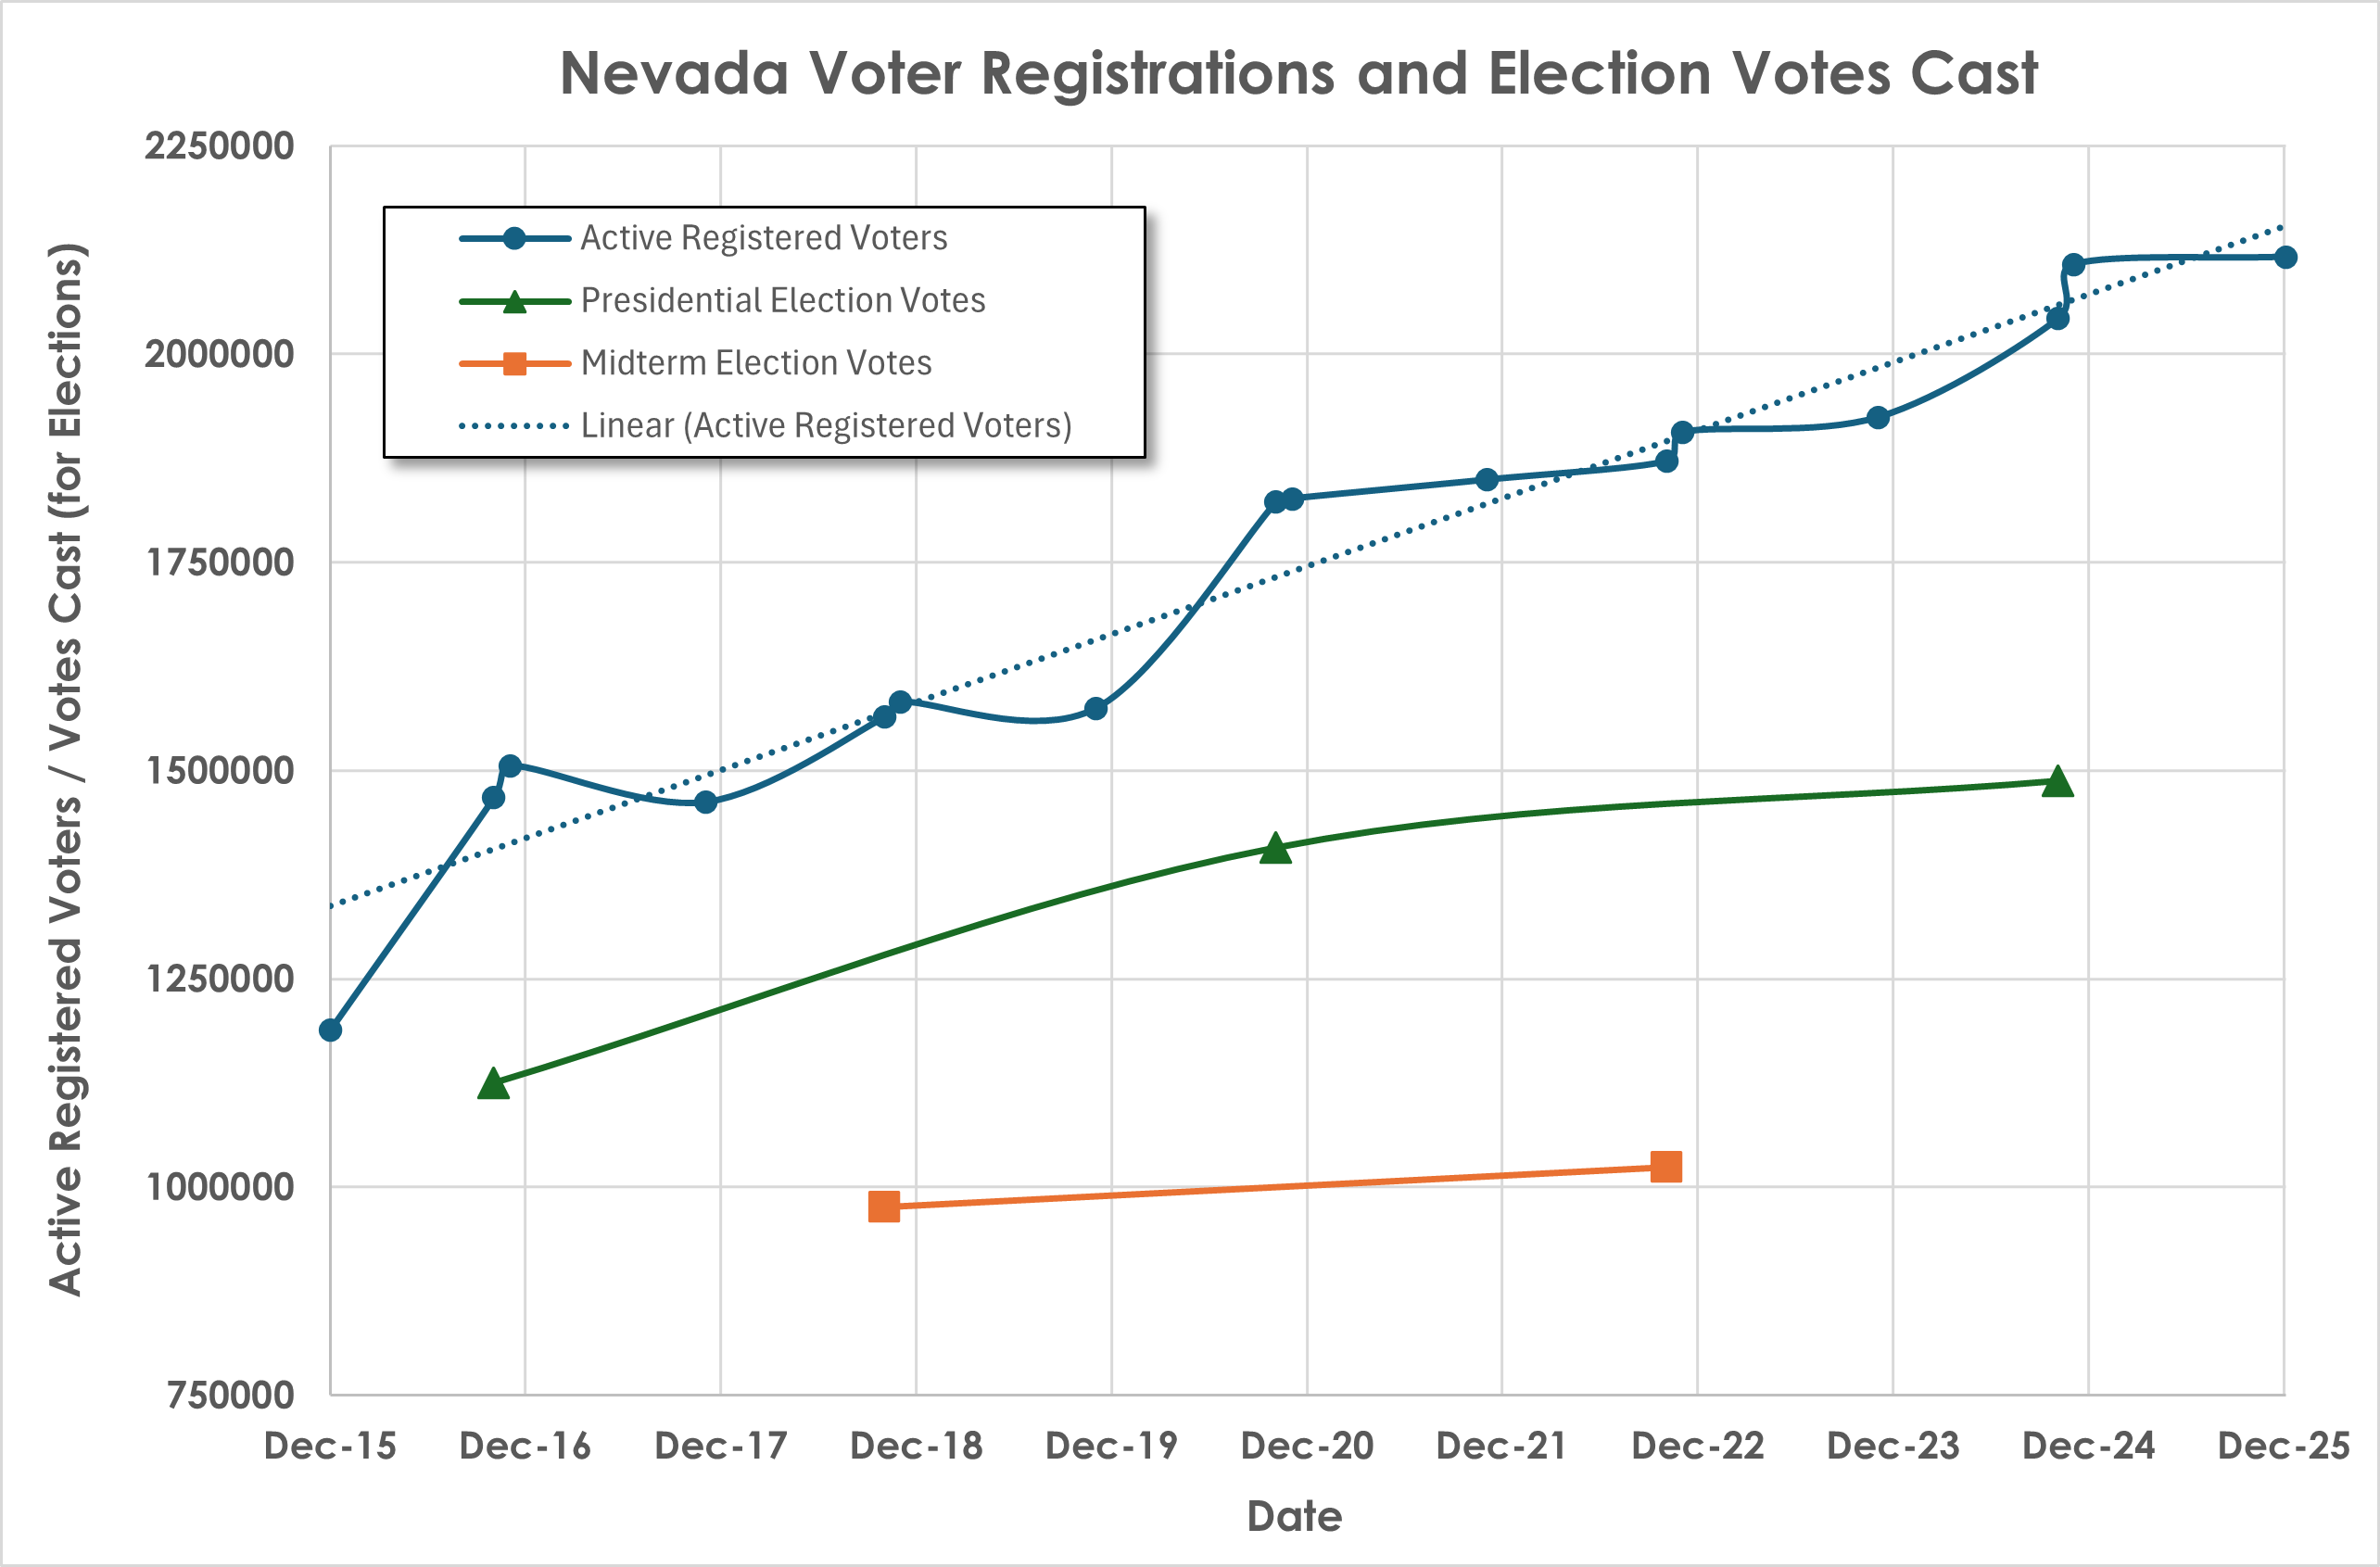
The key thing here is that the increase in votes cast through elections is significantly less than the trendline of the increase in voter registration numbers. For the three covered Presidential Elections (2016-2020-2024), voter registration increased 39%, while voter turnout only increased 32%. For the two midterms, the results were worse: a 19.2% voter registration increase netted just under 5% more ballots cast.
Between the 2018 and 2022 midterms, voter registration increased 19.2% but voter turnout by just less than 5%. Nevada’s 18+ Citizen population increased 7.3% in the same period.
Let’s put that into perspective. According to the Census Bureau’s ACS 1-Year estimates, table DP05, Nevada’s 18+ Citizen population increased 7.3% between 2018 and 2022. That 5% voter turnout increase represents only about 2/3rds of the change in eligible voter population growth, despite the fact that those new voters and other Non-Partisans were registered (the 19.2% increase in registrations).
It’s clear that removing the “obstacle” of having to register voluntarily is not increasing voter turnout—it merely increases the voter pool. Lower turnout rates in many counties after AVR is another piece of evidence that it is not working as intended.
Here is the crux of the problem: why? The answer that is apparently becoming the dominant narrative is that voters are choosing to become Non-Partisan because of distaste with the two major parties, or perhaps political parties in general. And then they are choosing not to vote in elections after choosing to be Non-Partisan. Given the contentious nature of the last two presidential elections and their aftermath, it is easy to see why people might feel this way, but that is a lot of choices to make.
My opinion, however, is that there is a certain (rather large) number of people who are not going to vote no matter what. You can make it easier to register and easier to vote, but they are not going to show up. In other words, we now have a bunch of people who were never going to voluntarily register to vote getting registered and then not doing anything else with the electoral system—including voting. That explanation fits the other data available much better—especially the rather moribund increase in election participation.
Evidence of A Long-Term Trend?
My suspicion of the “rejection of the major parties” narrative is also based on data I have been collecting for the Elko County Republican Party for the last few years. As elsewhere, there were questions early on about the impact of AVR. So we decided to track the changes from January 2019 forward (remember—AVR started in January 2020).
Below are the results of six years’ worth of data, based on the monthly registration statistics released by the Secretary of State’s office. I put these together as stacked area graphs to make it easier to see the relative strengths of parties over time.
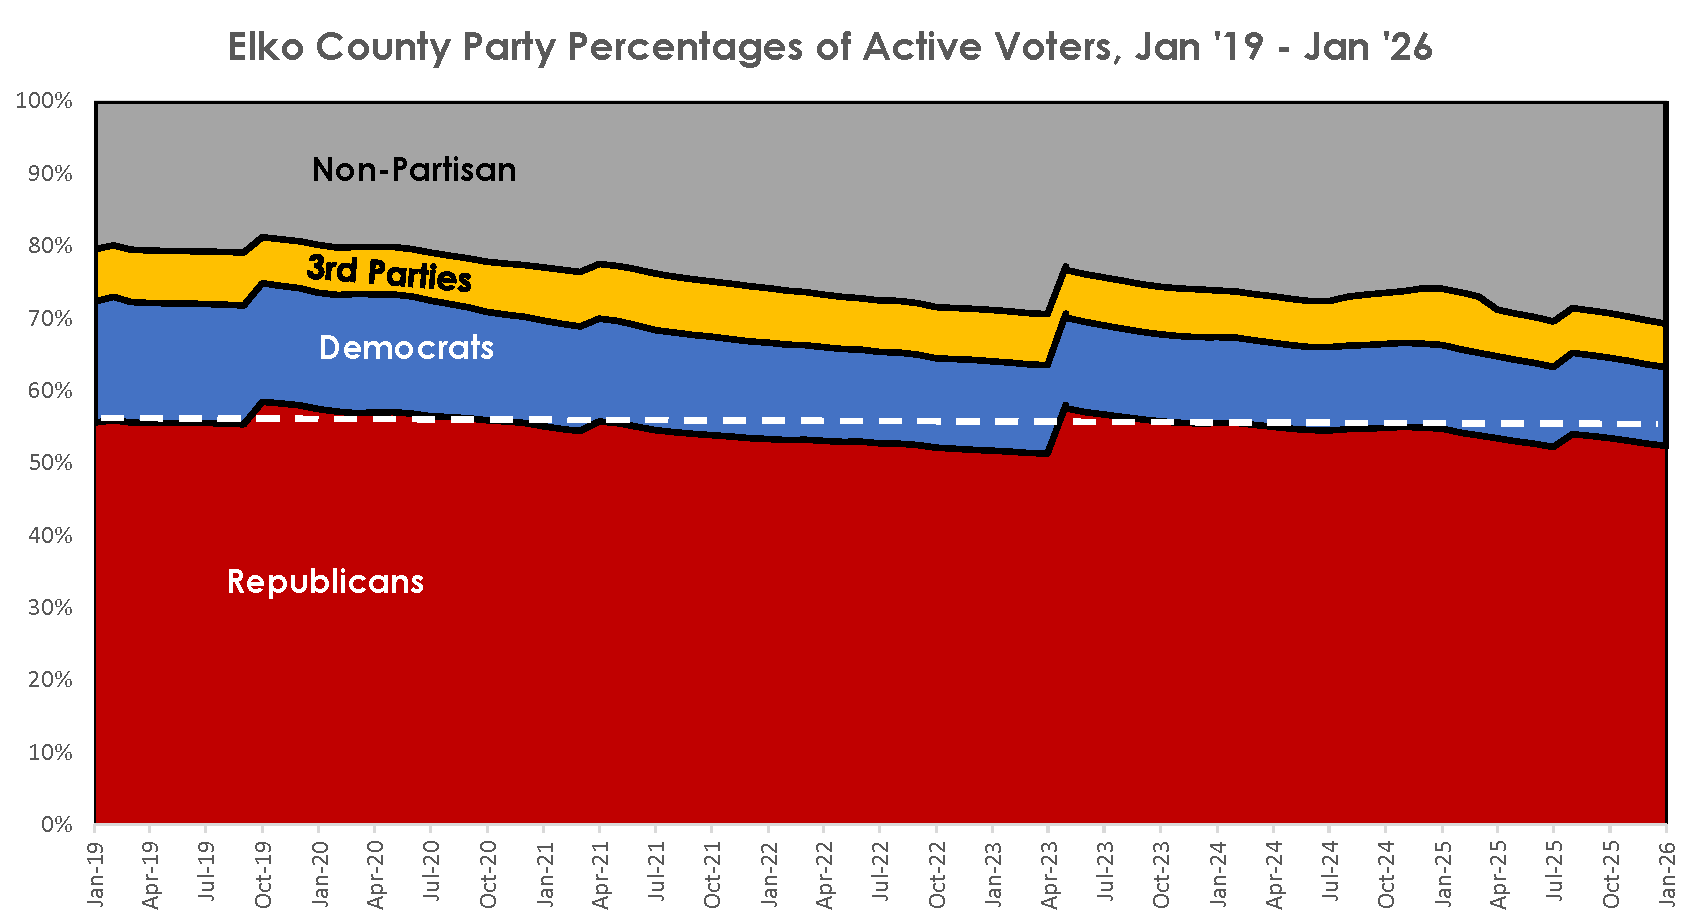
Two things to note. First is the series of “spikes” in the data. These spikes correspond to the periodic shifting of voters from the Active to Inactive categories by the Secretary of State’s office. This process is triggered if a voter has not voted in two consecutive federal elections and, among other things, means the voter will NOT receive a mail ballot automatically after being moved to Inactive.
Note that these spikes are not captured in the Reno Gazette-Journal graph at the top of the article—with one particularly important exception in 2023 (see below). The article graph measured year-over-year data, which is perfectly appropriate if trying to track some long-term trends. However, in this case, I think the approach is obfuscating a major issue.
The fact that the spikes go up at each of these adjustments indicates the biggest losses are among Non-Partisans. And these changes can be significant. In April 2023, during which those who had not voted in either the 2020 or 2022 General Elections were removed, the Non-Partisan share in Elko County dropped 6.5% through the single action of not including those who did not vote. Note the flat Non-Partisan growth in 2023-2024 in the RGJ graph—which corresponds exactly to this large spike (this is the exception noted above). It was sufficient to wipe out Non-Partisan gains across the state for the entire year.
The 2023 drop in Elko Non-Partisan voters is more than a percentage point higher than the decline that Neugeboren noted in major party shares in the entire year of 2025. It brought Elko Non-Partisans down to within 2.5% of their 2019 voter share of 20.5%—closer than the Democrats in Elko, who declined from 16.7% to 12.6% in the same period.
Also note these spikes have little to do with the introduction of AVR in January 2020. There was a similar movement in late 2019 and, I imagine, even earlier. One consistent trend across the “AVR divide” is Non-Partisans tend not to vote at higher numbers than voters who align themselves with political parties of whatever type (I discussed this issue in relation to the 2024 Election in an earlier article).
The second noteworthy item is the white dashed line, which marks 55%, the share of Republicans among all Elko County active voters in January 2019 when the data series started. Note that while the percentage of Republican vote share appears to drop for long periods, it goes back up to roughly the same 55% share (or indeed, higher) after the shifts from Active to Inactive. It then declines again in favor of Non-Partisans until the next shift, when it goes back up.
In other words, the Republican registration share in Elko County has been remarkably consistent in the six years since the introduction of AVR.
Good news for Elko County Republicans, of course. But the data does illustrate how misleading the “Non-Partisan” voter share might be as a marker of political opinion. If Non-Partisans are rejecting the major parties, they are doing so to the extent they are just not voting at all for extended periods—even in presidential election years. And if you are not going to vote, why bother registering as Non-Partisan?
Oh, that’s right—because of AVR, you have to register to vote unless you explicitly say you do not want to. It takes a positive action to ‘show the state’ you are not going to take an action you were not going to take anyway.
Of course, there are plenty of other possible narratives to explain this same data:
Elko is unique, and this is not happening elsewhere. Elko is going to Elko.
If it is common elsewhere, it indicates that the issue is not a rejection of the two-party system, but rather a tendency for non-dominant parties in areas to shrink in favor of Non-Partisans in an increasingly tense political culture.
We are at the beginning of a process that is not totally played out, and the real impact of AVR is not quite apparent yet as we are arguing over incomplete data.
I am not currently convinced of any of these alternatives. But I do think the simple story of a huge increase in the numbers of Non-Partisans represents some massive shift in political behavior is not supported by either the registration data or the voting behavior that Non-Partisans showed before and after AVR.
Occam’s Razor and Next Steps
Admittedly, Occam’s Razor might be playing a role in my thinking. Starting from the premise that the best explanation is usually the simplest one with the fewest assumptions made, I find the single assumption that AVR is bringing in a lot of people who would not have bothered to register or show interest in voting before to be rather elegant.
I find it more explicable than reading some collective thinking that requires increasingly large numbers of people to make a conscious choice to not only not register with a political party, but also not bother to vote in major elections consistently. That’s four choices a large enough group of voters in Nevada would have all had to make to explain the data.
And this does not even touch the frequent reoccurrences of voters being incorrectly placed in the Non-Partisan category as recently as September 2025.
So how do I plan to dig deeper into these various issues to get at it one way or the other? Well, late nights and too much caffeine, of course.
There are a lot of ways that the data might be parsed. But I want to start by looking at how this breaks down at the county level and then between the Three Rurals. I suspect that the growth of Non-Partisans is much less an issue in the rurals than in the urban areas—which could shed additional light on the matter. And given that another midterm election is coming, that might be some useful data to look at.
Another issue that I want to delve into is the effect age has had on these issues. I have discussed in past articles that age is probably the single greatest indicator of registration and voting behavior. Grappling with the relationship between age and party registation should be enlightening.
In either case, there is going to be a lot of data coming your way.
This is solid analysis. thank you. gives you some bedrock to build other hypotheses on. every study I have ever seen shows a high correlation between age and voter participation (younger do not participate, as you age you do). It could be as you age, you feel there is more at stake so you vote. Or, it could be you finally decide to do your "civic duty", which to me is a poor excuse to GOTV. Internally, what do we have to do as Republicans to spur people to register as Republicans, and then go vote? Agree very much there is a lot of distaste with both political parties today
There is no doubt in my mind that AVR is driving the spike in non partisans. One walk through WalMart and it's obvious that a healthy portion of the population can barely handle their daily lives, let alone political affiliation. That being said, I have always thought, if you want to know a people, see how they vote in a primary. This is completely anecdotal, but in my voting lifetime I have always been surprised at how well independent and libertarian candidates do in Elko county. Not “registered” Independent and Libertarian candidates, but Republican candidates that tend to lean independent or libertarian do well during the Republican primaries. That tells me that Elko county, while majority Republican has a strong independent streak, but when the chips fall during an actual election they vote for the party candidate. All of these registrations can't be assumed laziness though. Certainly the back and forth of both parties drives a portion of the population to not be affiliated with either. This has the potential to be a beneficial. I prefer a two party system that doesn't have a crop of “in the bag votes” every voter should be “corted” as a potential vote, not just the unknowns that flip flop every four years.